
2.1 Absolute numbers versus ratios and percentages
Comparing quantities is easy, each of the quantities is defined to a specific standard and then the comparison between them takes place after that. Comparing quantities can be effectively done by bringing them to a certain standard and then comparing them related to that specified standard.
For instance, if we quantify a particular thing with respect to 100 portions of the same thing, this is referred to as percentage comparison. Or else if we compare the two things with respect to each other, then we calculate the ratios of these two quantities.
Ratio
In simple terms, comparing Quantity1 with Quantity2 is Ratio. The first quantity(say p) is mentioned in the numerator and the second quantity(say q) is mentioned in the denominator. The way to depict the ratio is p/q.
Percentage
Comparing Quantity with 100 portions of the same quantity in the denominator is Percentage. The first quantity(say p) is mentioned in the numerator and the second quantity(say q) is mentioned in the denominator. This quantity when multiplied by 100. The way to depict the ratio is (p/q)*100.
Relative vs Absolute Change
The problem with Relative vs Absolute changes
When numbers change people can report how big that change was in relative or absolute terms.
Relative change - By what percentage (larger or smaller) did the number change from the original number?
Absolute change - What is the difference between the original number and the new one?
While these two statements do not sound that different, let’s explore how they can each be misleading.
Relative changes
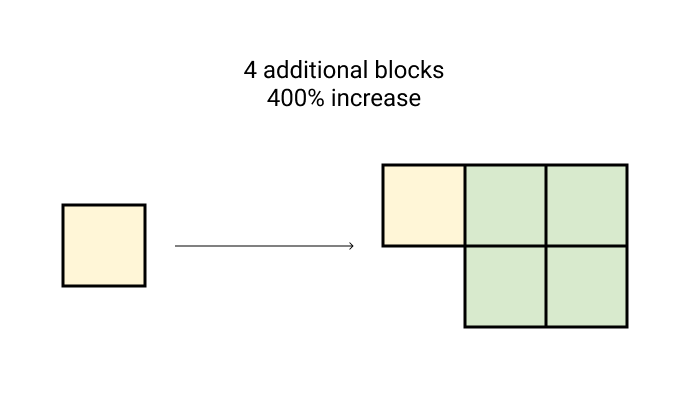
Relative changes on small numbers can appear to be more significant than they are. This is because a small absolute change in the number can result in a large percentage change.
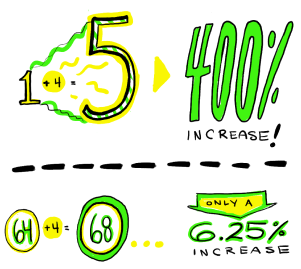
So if I got a $50 return on my $10 investment, my relative change was a 400% increase.
There is also some variation in how relative changes are reported. Here we have a 400% increase which is also the same as saying five times as much. This becomes more confusing when a relative change is negative. Something that is five times as small is an 80% decrease from the original amount.
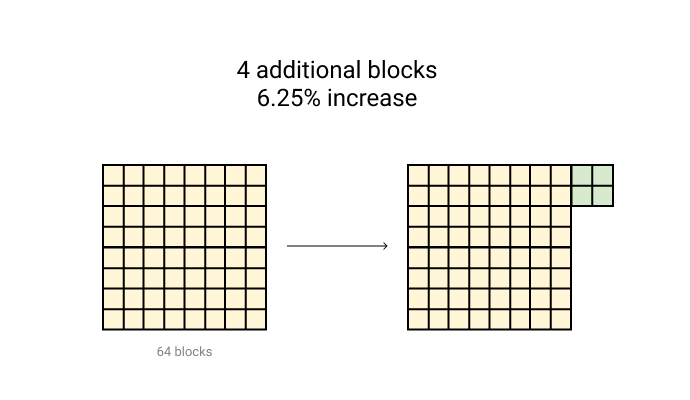
Relative changes on big numbers can appear less significant. This is because any absolute change in the number needs to be large to show a large relative change. Even when the absolute change is large, if it is a change on a larger number the relative change can be small. Let’s say that the national deficit increased by 5%. This may seem small, but the actual increase or absolute change to the $20,000,000,000,000 budget is $1 trillion.
Absolute changes
Absolute changes work the other way:
Absolute changes on small numbers can look small even if their relative changes are large. To allude to the example used earlier, I earned $40 on my investment.
Absolute changes on big numbers can look big even if their relative changes are small. The deficit has increased by $1 trillion.
When to use Relative vs Absolute change
Use Both
When choosing between reporting a relative change or absolute change, take a second to think about whether you are choosing the type of change that best represents what is actually happening. Or, are you simply selecting the more sensational number? The best practice is to provide both numbers. Personally, I recommend putting the less sensational number first so people have context and are not distrusting when you reveal the less significant number.
Context Matters
When numbers change, we want to know the reason. Sometimes the context completely changes the story. If home prices increased by 20% over the past ten years we might be concerned about this trend. However, if you factor in inflation which also increased by 20% over the past ten years, then the relative value of homes has stayed constant. Even if the change in home prices was put in absolute terms, there was no actual change in the value of the homes. For any chart focused on tracking a monetary value over a time period, you will always need to adjust for inflation.
Compare
To get a clearer idea of whether an absolute or relative change is significant, compare it to other changes that are related to it. For example, if sharks kill 16 people per year, and this year they killed 20, that is a 25% increase of sharks killing people. If you compare this to heart disease killing approximately 600,000 people per year, the total number and the relative change of shark-related deaths don’t sound so significant. Even if heart disease declined 25% in the same year, it should still help us better understand the lack of significance to shark-related deaths.
Interpreting Relative vs Absolute change
Let’s look at an example of changes in share price to demonstrate how the change in price could be represented in different ways.
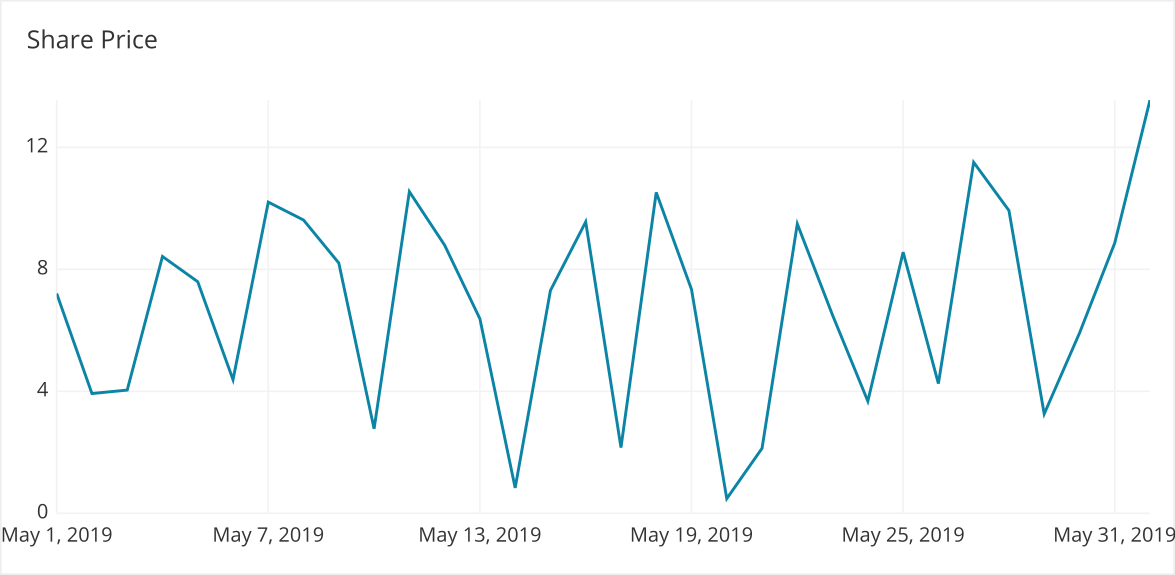
Here we can see the absolute change in price everyday. There is a lot of variance which can distract from the relative and absolute returns of the investment. If we bought the stock on May 1st we could look at the return per share in absolute terms.
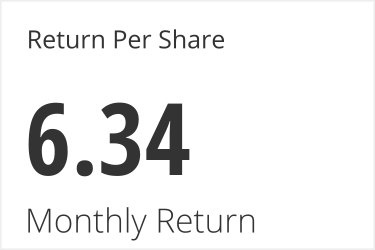
Now this may not look like that much money but when we look at the relative change from our starting positions we can see we got a high relative return on our money.
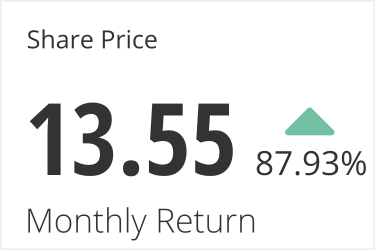
Next time we would want to put more money in so that the absolute return would be bigger.
Summary:
Relative changes on small numbers often look big.
Relative changes on big numbers often look small.
Absolute changes on small numbers often look small.
Absolute changes on big numbers often look big.
Explore both types of changes when looking at data
Last updated